Closer look to Triwave and MSE
After getting started to work with the new Synapt G2 HDMS from Waters a few questions about the working principle of this machine came up. Here I’ll try to explain where the drift time detector is located and how the software can distinguish between fragments produced in the trap and transfer cell, respectively.
As far as I know Waters is the first manufacturer who joined the IMS- and QTOF-technologies to combine all well known benefits from the QTOF instruments plus the advantages of separating ions by their shape and size.
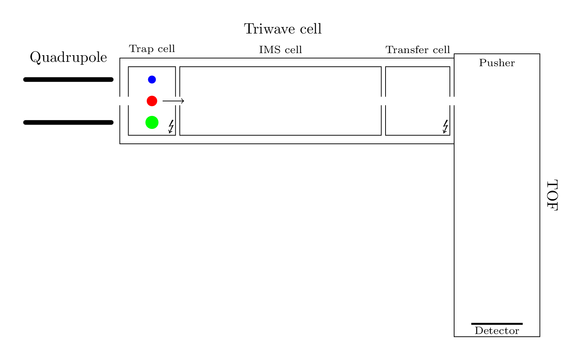
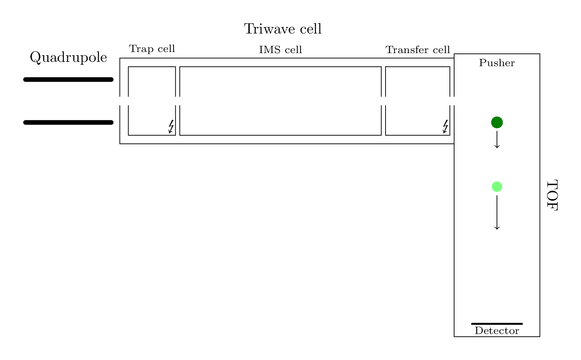
But lets start at the beginning. As any other MS instrument the Synapt carries an ion source. Here are also some attractive innovations located, but nothing remarkable for now, so I won’t explain anything of it. The interesting magic part starts when the ions pass the quadrupole. To give you a visual feedback of my explanations I created an image of the hierarchical ion path:

Assume only one big black ion has entered the machine and found its way to the quadrupole. This ion will now follow the ion path and arrive at the Triwave cell, consisting of a trap cell, the new IMS cell and a transfer cell. Trap and transfer cell are able to fragment the ions, so you can produce fragments before and/or after separation by ion mobility. Producing fragments is nothing new, most of the MS instruments out there are able to do so.
So consider this big black ion is decayed in the trap cell into three smaller ions, a blue, a red and a green one:
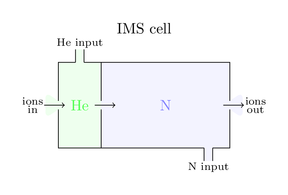
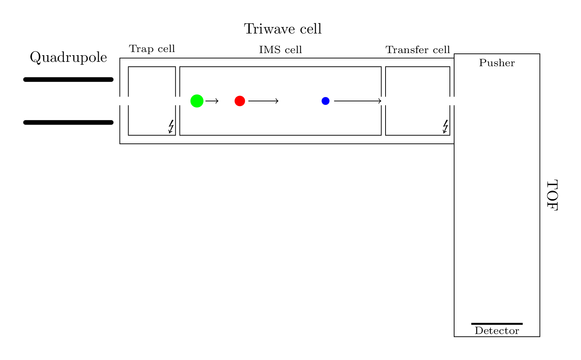
As the figure indicates all fragments have different shape sizes and actually share the same velocity. They now enter the magic IMS cell and an IMS cycle starts. This cell is a combination of two chambers. One small chamber at the front of this cell is flooded with helium and operates as a gate. During an IMS cycle it is impossible that further ions can pass this gate. The main chamber of the IMS cell is filled with nitrogen. The pressures of helium and nitrogen are sensible tuned, such that nitrogen doesn’t form an counterflow for incoming ions. Here is a smart graphic of both chambers:
These nitrogen molecules represent a barrier, so the passing ions are slowed done while they have to find their way through this chamber. Here is the awesome trick located! The bigger the ion shape the bigger the braking force and the slower the ion. A heavy but compact ion might be faster than a lightweight but space consuming ion. So the drift time through the IMS cell is independent of m/z values, it separates the ions by their shape size. Back to the example the blue ion is much smaller so it is much faster, in contrast the fat green ion is inhibited a lot by this nitrogen gas:
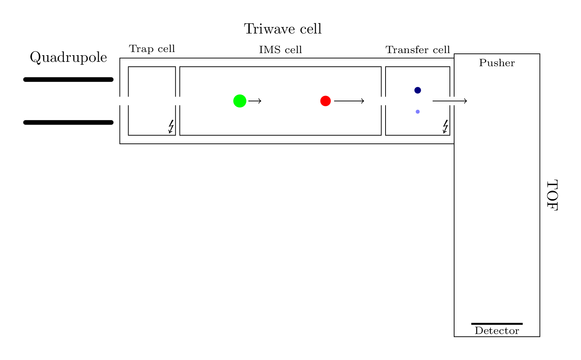
Thence the blue fragment arrives first at the transfer cell. Here it is again fragmented in smaller components:
Each of the smaller blue ions then reaches the TOF analyzer. Here they have to fly a specific way, the required time is tracked at the TOF-detector. Heavier ions are slower, so the resulting m/z values are measured here:
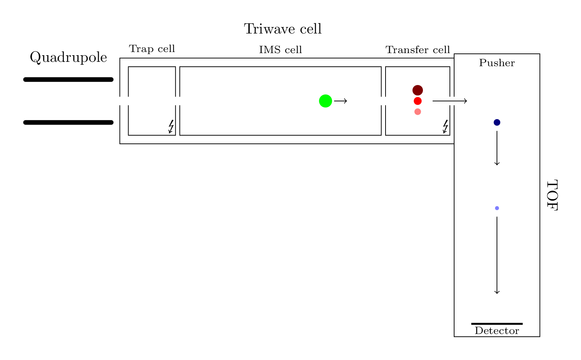
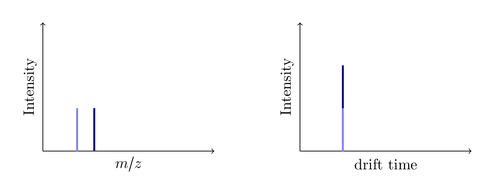
The first acquired spectrum is recorded. All blue ions have the same drift time (they were all present when the pusher pushed), but are distinguished by their mass:
At the same time the red ion was able to reach the transfer cell and got also decayed again. Passing the transfer cell they reach the pusher and the next push will make them fly through the flight tube:
All red fragments also have the same drift time, but this time differs from the drift time of the blue ions. Nothing was said about their mass, the m/z isn’t determined before their flight through the TOF analyzer! So it might (and will) happen, that they are lighter than the blue ions. At this point the spectrum will look like this:
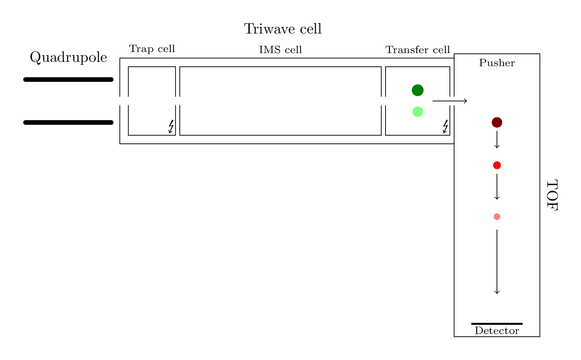
The same will happen with the green ions. Entering transfer cell, getting decayed, flying with the next push:
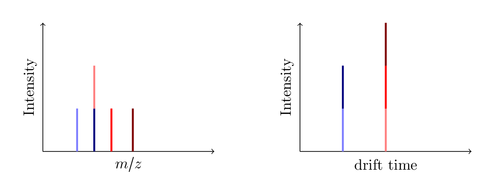
At the end the spectrum produced by the big black ion might look like this:
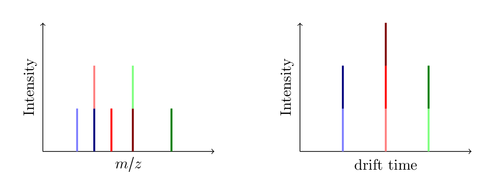
You see, the drift time is measured without any additional IMS detector! A common MS instrument is just able to record the left m/z spectrum, so if it produces the same seven fragments you are only able to identify five peaks. Since the dark blue and the light red ions have the same mass (they are called isobars) the produced peak is a merge of both ions. Same issue with the dark red and the light green ion. The new IMS technology now enables you to split this peak by the required drift time. Nice, isn’t it?
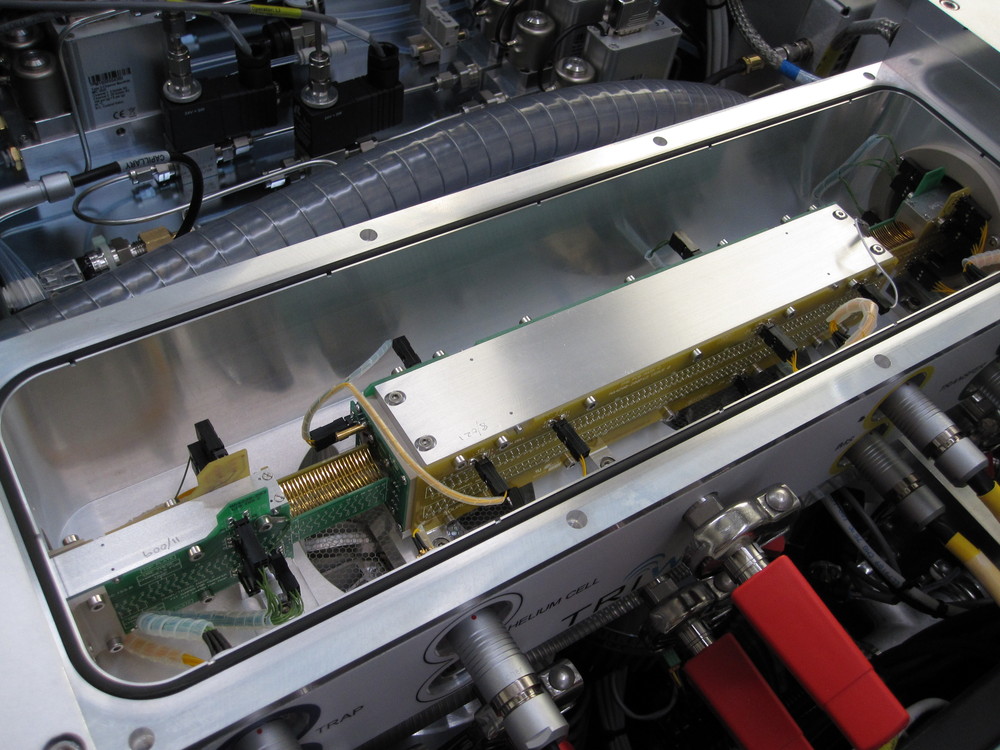
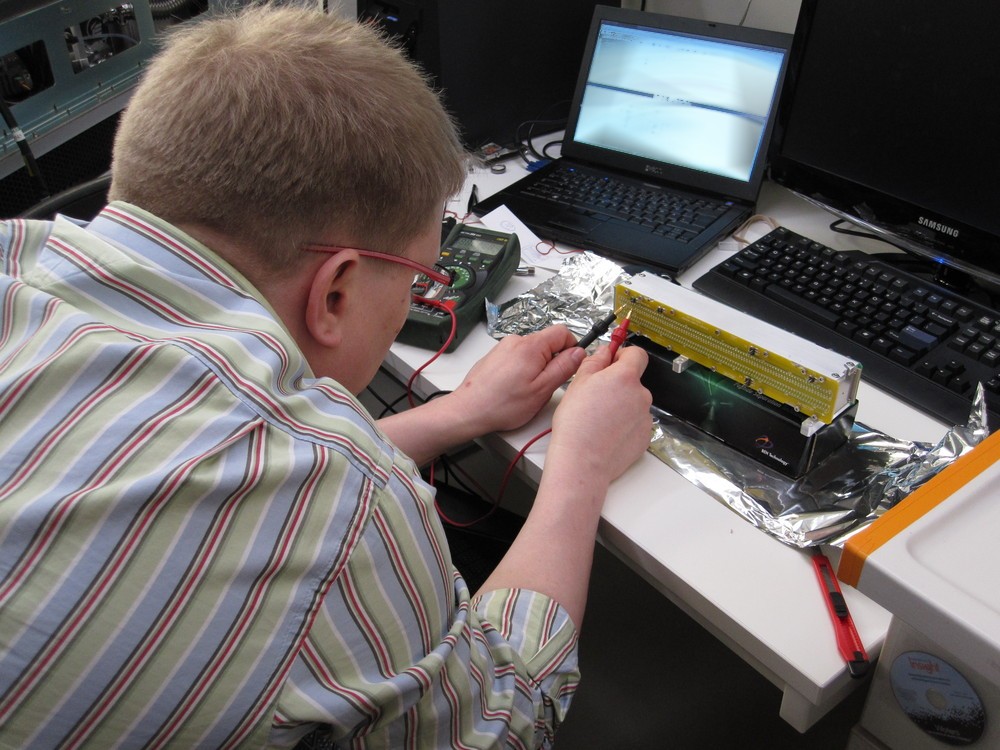
Ok, so far, back to reality! First of all I have to say the images are not true to scale, I’ve warped the elements for a better representation. The size of the IMS cell is not comparable with the size of the TOF! Fortunately the IMS cell was broken so I was able to look into the machine (figure 1). While the TOF is about 1m the IMS cell is a bit longer than half of a keyboard length, see figure 2. By the way the ions don’t fly a linear way through the TOF analyzer. The Synapt operates with reflectrons and knows two modes: V-TOF (ions are reflected once) and W-TOF (ions are reflected three times).
The energy beam transporting the ions through the IMS cell can be understood as a wave. You can define the wave height and the velocity to effectively separate your present ions. Don’t ask me why the call it height and velocity, and not amplitude and frequency, but what ever ;-) These two parameter are nevertheless very sensitive. So if they are not chosen very well, an ion might need longer then one IMS cycle to pass the cell, so it enters the transfer cell when the next cycle is still started. I don’t have any empirical knowledge yet, but it seems to be hard to find a well setting.
The complexity of this system of curse increases crucial if there isn’t only one big black ion in your machine! So analyzing is not that trivial as my images might induce. You are also able to separately enable or disable fragmentation in trap and transfer cell. So your awareness of this process is essential to understand the resulting data.
In reality one IMS cycle takes the time of 200 pushes, but the pusher isn’t synchronized with the IMS gate. What did he say? Time to get confused! If an IMS cycle takes exactly the time of 200 pushes, ions that arrive between two pushes (one push of course takes some time) should be lost every time, because they should arrive with the next IMS cycle, exactly +200 pushes, again between two pushes. This scenario would mean your sensitivity is crap. Theoretically correct, but fortunately we can’t count on our hardware. Even if you tell the pusher to push every 44 μs, the consumed time will fluctuate in the real world. So he’ll need 45 μs for one push and 43.4 μs for the following. Instead an IMS cycle will always take 44*200=8800 μs, independent of the real time the pusher needs for 200 pushes. So if an IMS cycle starts exactly with a push the next cycle will probably start within two pushes and ions that weren’t able to catch a push last time might now get pushed.
All in all you have to agree that this is an absolutely great invention. If you are interested in further information Waters provides some videos to visualize the IMS technology, and here you can find some smart pictures of the Triwave system in a Synapt.
- analyzed (15) ,
- bioinformatics (22) ,
- crazy (8) ,
- explained (43) ,
- ms (5) ,
- university (42) ,
- waters (3)

Martin Scharm
Leave a comment
There are multiple options to leave a comment:
- send me an email
- submit a comment through the feedback page (anonymously via TOR)
- Fork this repo at GitHub, add your comment to the _data/comments directory and send me a pull request
- Fill the following form and Staticman will automagically create a pull request for you:
3 comments
never worked with MS, not yet thought about something like this, but the technology sounds quite interesting!
could you please provide some real life spectra? thanks in advance!
Hey Matthew,
I’ll see what I can do for you, just come back tomorrow!
Kind regards, Martin